01 · Healthcare logistics
Healthcare operations from research to production
EstarMed · Lead Product Designer & Product Engineer
- 414 → 987 Monthly visits
- 27% → 97% Complete field records
- 0 Added coordination staff
01 · Healthcare logistics
EstarMed · Lead Product Designer & Product Engineer
Case study
From spreadsheets to a real-time home healthcare operation. I led field research, product definition, five role-based experiences and the full web and React Native implementation — scheduling, field execution, live GPS monitoring and auditable billing in one system.
Monthly visits
414 → 987
+138% · Nov 2025 → Jul 2026
Complete field records
27% → 97%
real arrival + closing stamps
Extra coordinators
0
same team, more volume
01 · Impact
0102/10
EstarMed did not simply digitize an existing spreadsheet. It changed how information was created in the field, how coordination understood the day in real time and how completed work became auditable billing.
Figures compare November 2025 — the first full month on the platform — with July 2026, measured directly against production records for visits, routes and patients. They are not perception survey results.
02 · Ownership
0203/10
I observed the operation, defined requirements, designed the product, built the web and mobile experiences, integrated the data and real-time architecture, tested the system and delivered it to production.
Lovable and Cursor accelerated implementation and iteration; responsibility for product decisions, architecture, code adaptation, integrations, QA and production quality remained mine. Operations stakeholders supplied contractual rates, clinical constraints and business rules, then validated the system in daily use.
03 · Context
0304/10
Healthcare professionals and drivers leave every morning to deliver vaccination, breastfeeding support and home-care services. Before EstarMed, a complete month of scheduling was assembled by hand. After vehicles departed, the state of the operation could only be reconstructed through calls, WhatsApp and end-of-day paperwork.
The challenge was not a more attractive dashboard. It was supporting a healthcare operation with little margin for error: if a visit disappears from the workflow, a patient can remain unattended.
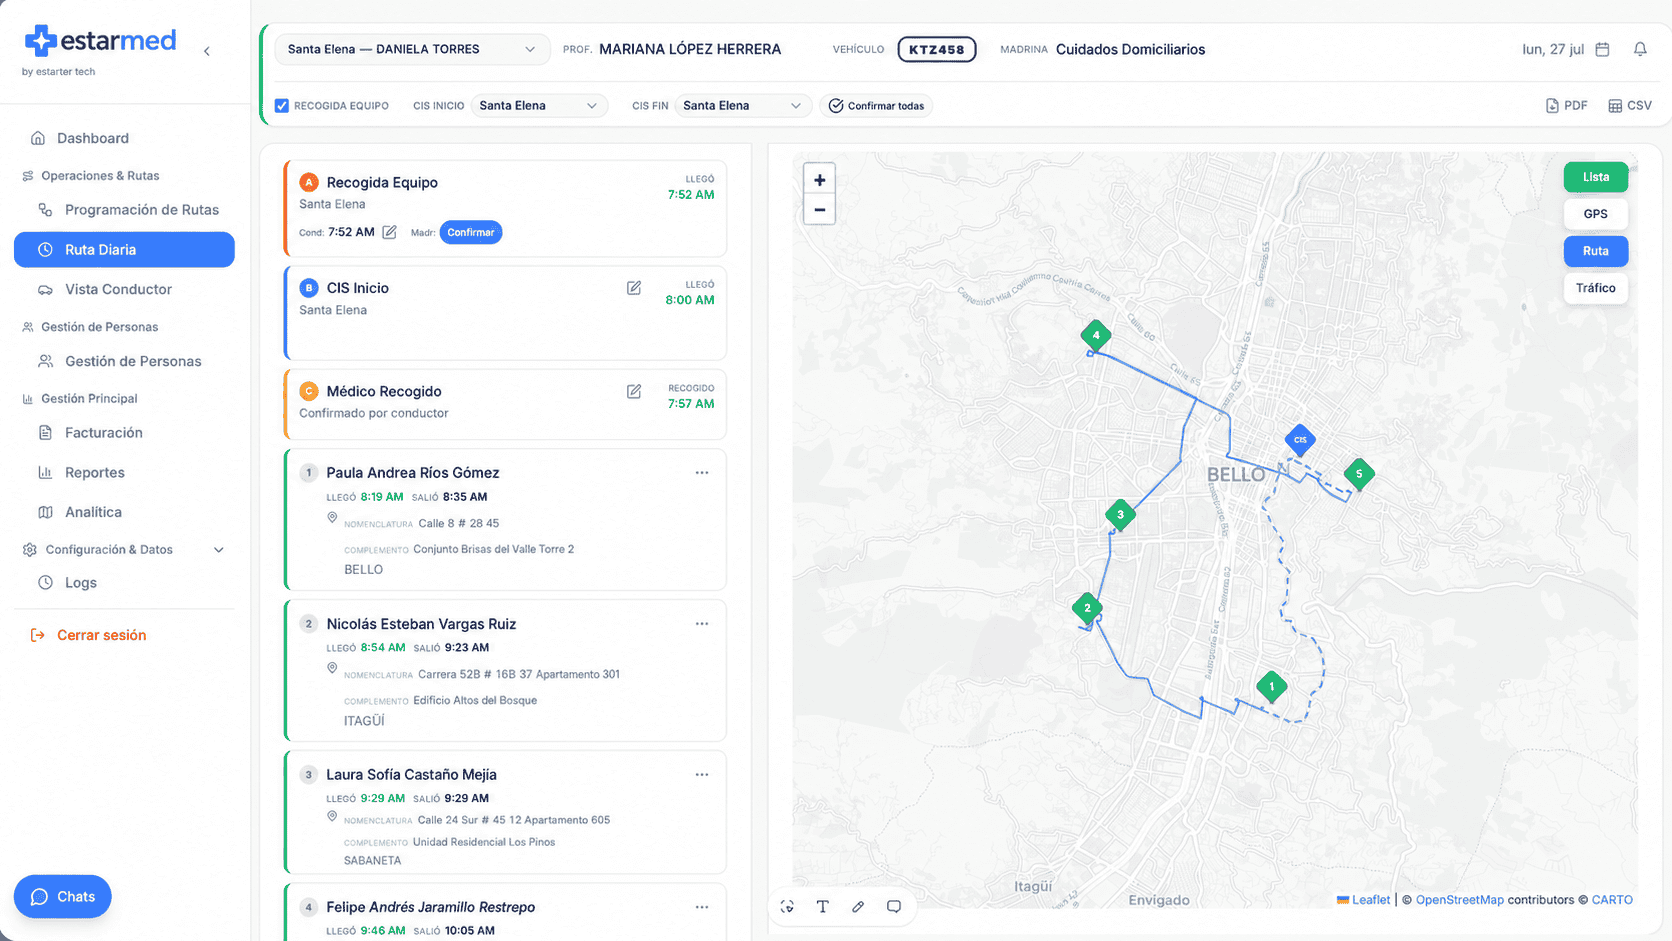
Interface · Daily route
Desktop
Coordination opens the day on one screen: patient list, assigned crew and live GPS position of every vehicle.
04 · Research
0405/10
I combined stakeholder interviews, full-route observation, spreadsheet audits and an in-product UX survey available to every role. The goal was to understand not only what people said they needed, but how information was actually lost, recreated or corrected during a working day.
“If the address is wrong, I lose half an hour driving in circles while the doctor waits in the car.” — Driver. “I don't know where each route is until someone calls me. If nobody calls, I find out the next day.” — Coordination. “One hand holds the equipment bag, the other the phone. I can't be hunting for buttons.” — Driver.
05 · Workflows
0506/10
The product follows the service from monthly planning through daily assignment, field execution, live monitoring and billing. These are not isolated modules: each event created in one stage becomes evidence for the next.
All patient names, addresses and identifiable operational data shown here have been anonymized or replaced with demonstration data.
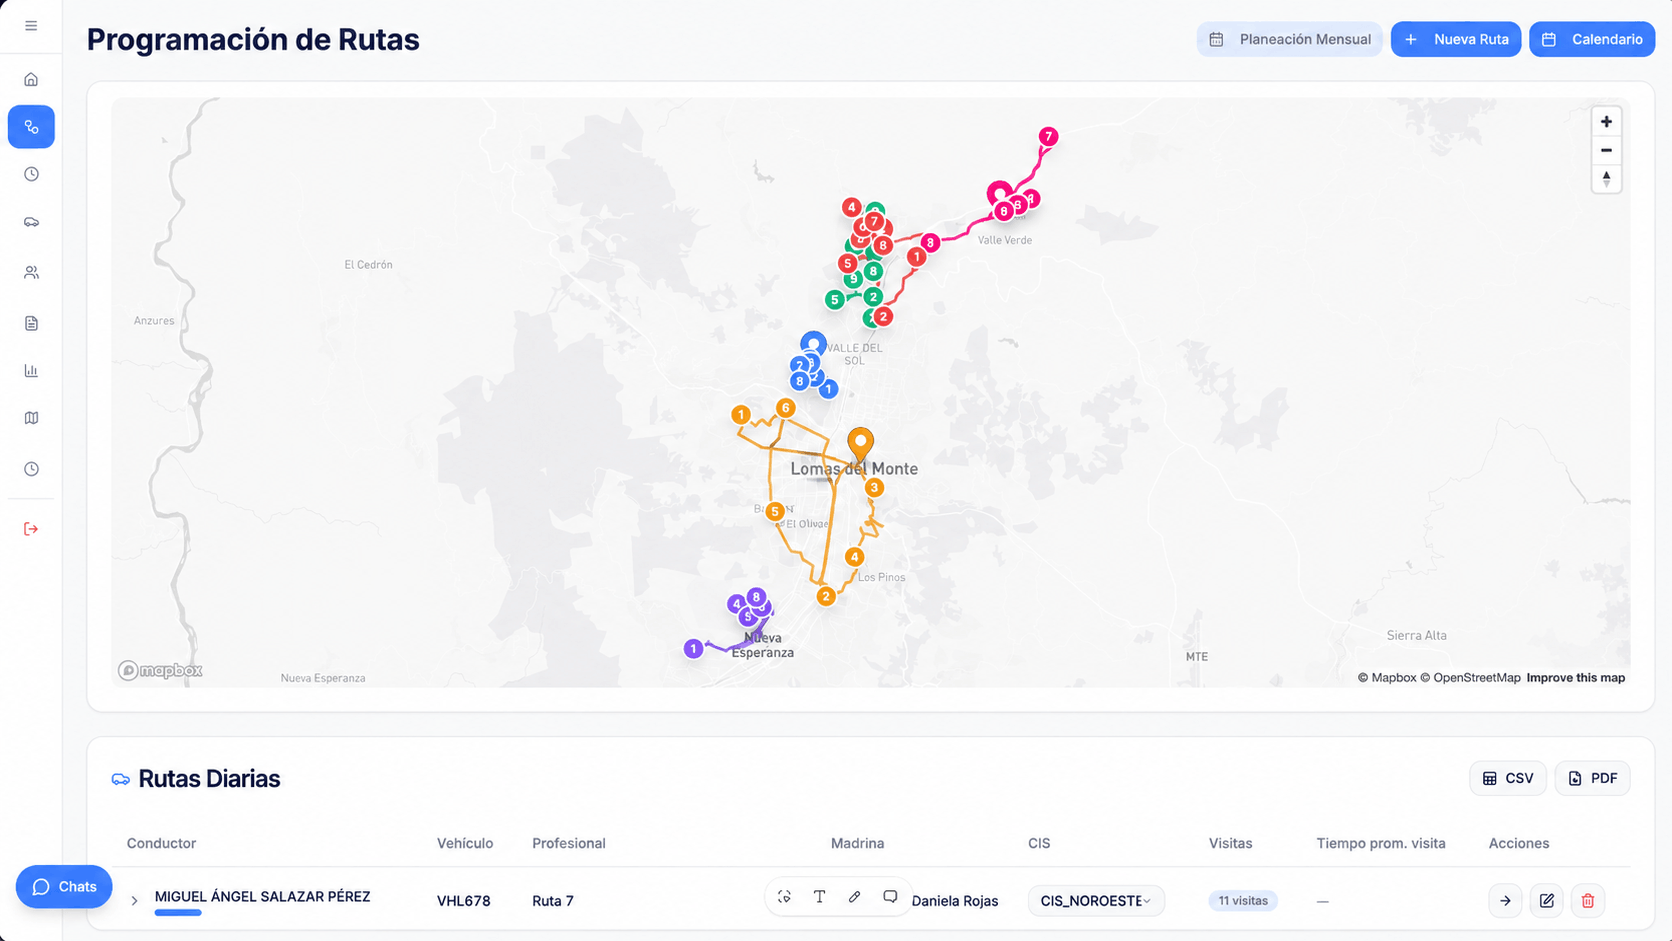
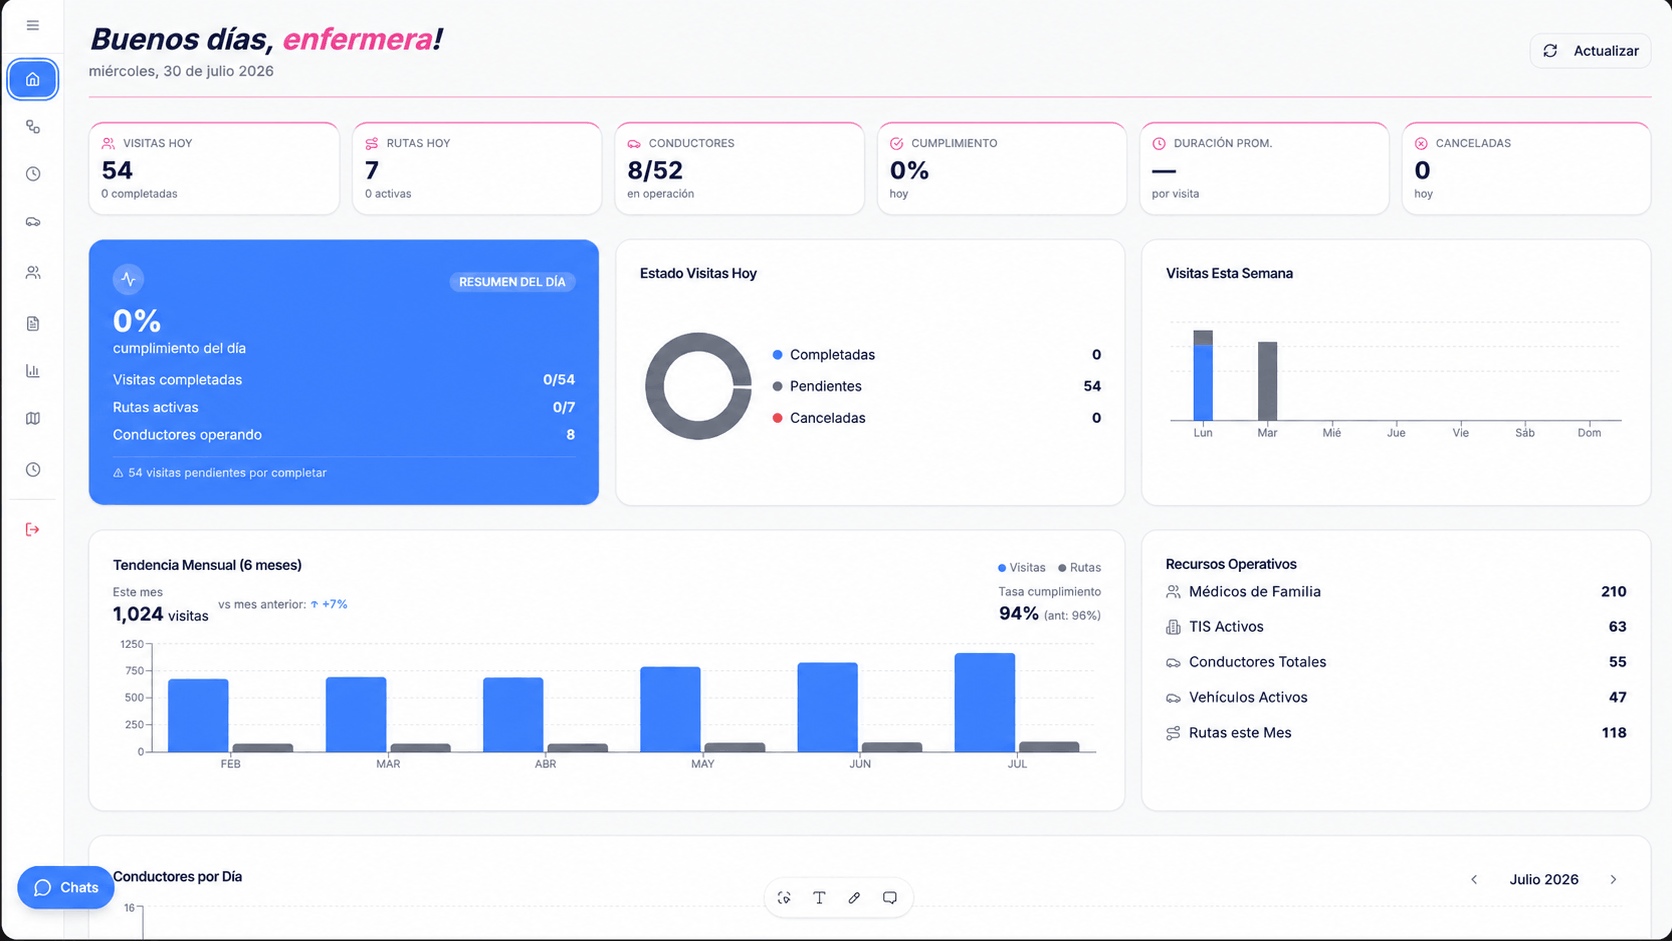
Interface · Programming and control
Desktop
Monthly programming builds routes across crews and vehicles; the operations dashboard turns completed work into auditable numbers.
06 · Decision
0607/10
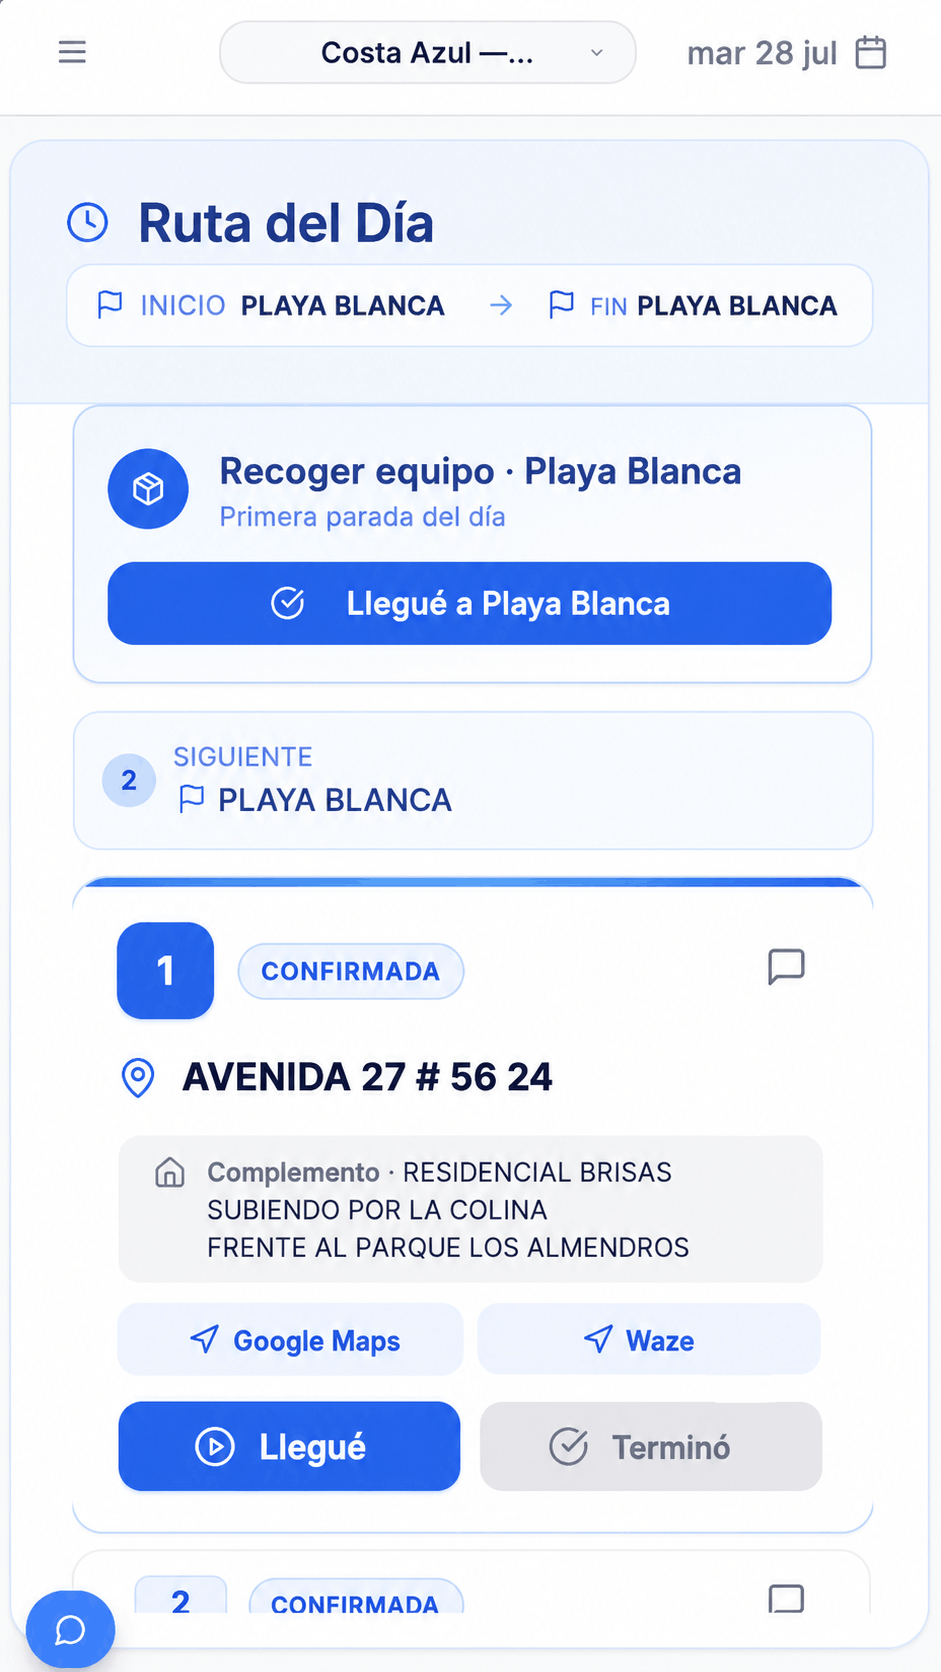
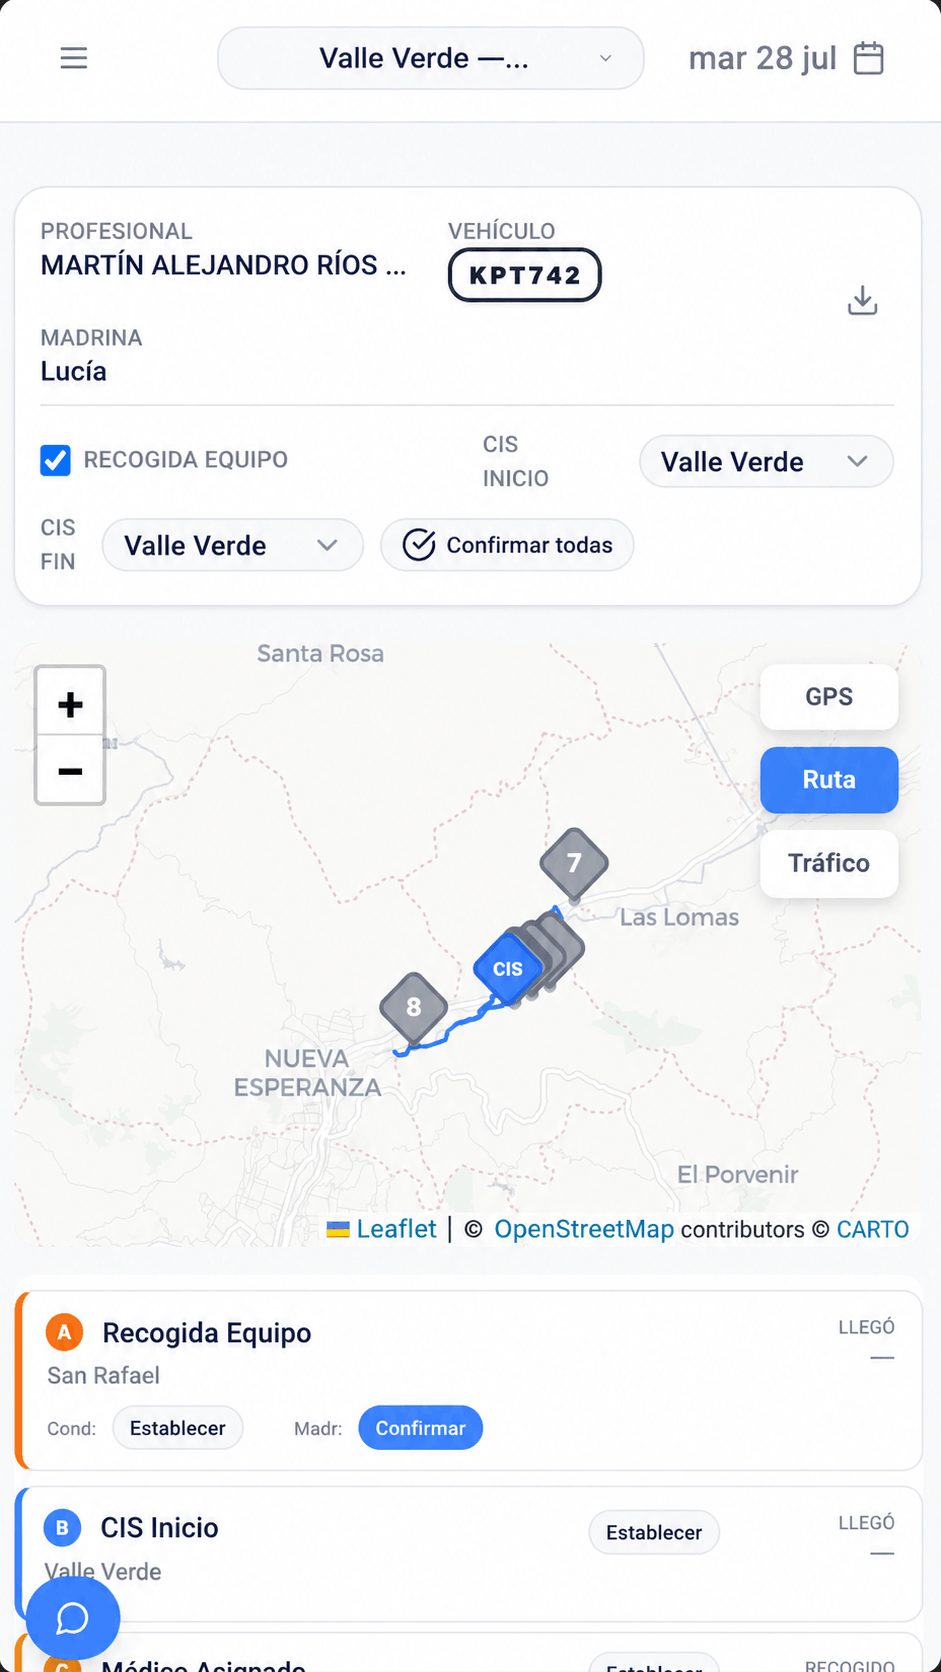
The most consequential design decision was removing simultaneous choices from the driver card. Version 1 showed “Arrived” and “Finished” together, and on real routes drivers frequently selected “Finished” without recording arrival. In version 2 the next action only appears after the previous event is recorded, so capturing arrival became part of the path rather than an act of discipline.
A second iteration replaced ordering by estimated time — which reshuffled the screen mid-route — with an explicit coordinator-set sequence. Time became supporting information rather than the structure of the screen. The best UX improvement in the project came from removing choices, not adding controls.
Interface · Field execution
Mobile
In the field there is one valid action at a time: the driver confirms arrival and closing, and the route stays readable on a phone.
07 · Validation
0708/10
Full-shift observation with drivers plus an embedded in-product survey drove the changes that mattered. Complete field records — measured directly in the database — moved from 27% to 97% after the field workflow redesign.
Honest limitation: formal SUS and NPS studies have not yet been completed. Current validation is primarily behavioral and operational.
08 · Engineering
0809/10
I designed and implemented the product, so interaction decisions moved directly into production components across React and React Native. Design engineering reduced translation loss between intent, interface and code.
Accessibility was built into the token layer: AA contrast, color always paired with label and icon, keyboard order and visible focus for coordination, 44×44 px field controls and domain language instead of generic software vocabulary.
09 · Results
0910/10
EstarMed connected planning, field execution, live location and billing into one operational system. Monthly completed visits increased from 414 to 987 while the coordination team remained the same size, and complete field records improved from 27% to 97%.
Field products must be designed for sunlight, urgency, movement and unreliable connectivity — and reliable data begins with the interaction that creates it. Next: complete offline coverage across remaining field workflows, formal SUS validation with the Bogotá cohort and deeper predictive capacity analytics.
Live product
See the work in its real context.